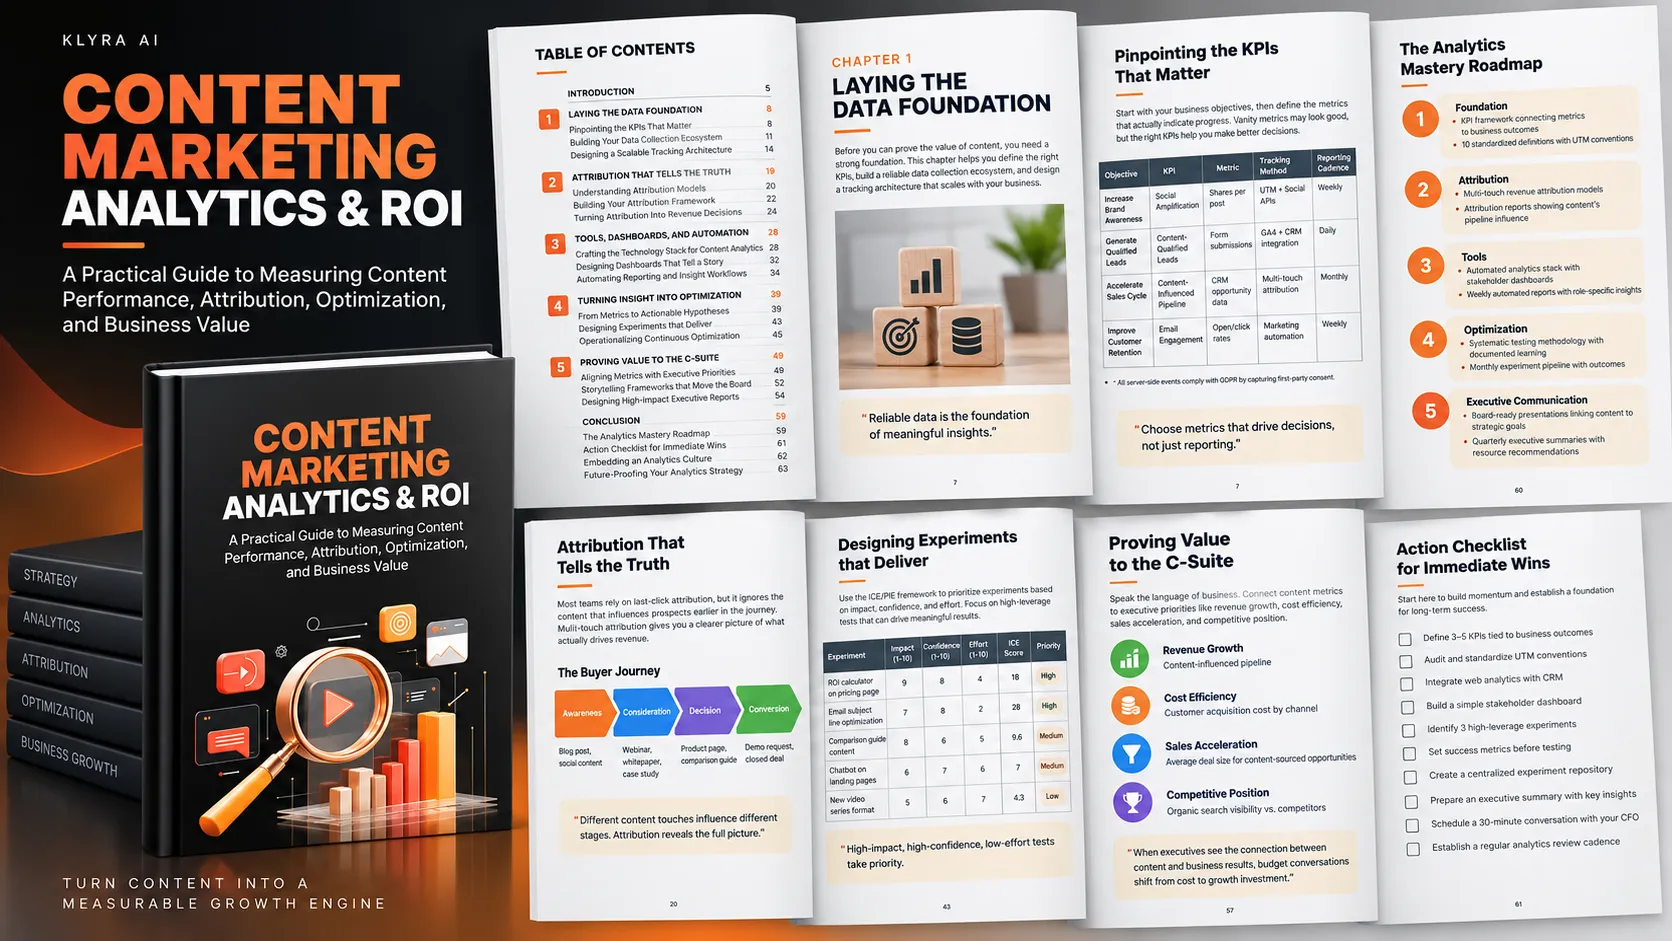
Content Marketing Analytics & ROI
Content marketing becomes difficult to defend when teams can demonstrate activity but cannot clearly demonstrate business impact. A program may produce blog posts, whitepapers, email campaigns, social content, webinars, and other assets while reporting primarily on traffic, shares, opens, or time on page. These numbers can describe what happened, but they do not necessarily explain whether content contributed to qualified leads, pipeline, revenue, customer retention, or other business outcomes.
The central challenge is moving from activity measurement to business measurement. This resource presents a connected approach that begins with reliable data and meaningful KPIs, progresses through attribution and analytics infrastructure, turns insights into experimentation, and ultimately translates results into executive-level business language.
1. Build the Data Foundation First
Advanced analytics cannot compensate for unreliable underlying data. The resource therefore begins with the measurement foundation: deciding what matters, establishing consistent definitions, collecting the right information, and creating a tracking architecture that can scale.
Focus on Business Outcomes, Not Vanity Metrics
Metrics such as page views, social shares, and time on page can provide useful context, but they become problematic when they are treated as evidence of business success without a connection to outcomes. A rise in traffic accompanied by flat revenue, for example, does not automatically indicate that content performance has improved.
Actionable KPIs should help teams make decisions. The measurement process should start with business objectives and work backward toward the metrics and tracking methods required to evaluate progress.
A useful measurement structure connects an objective with a KPI, a specific metric, a tracking method, and a reporting cadence. The resource provides examples including social amplification for brand awareness, content-qualified leads for lead generation, content-influenced pipeline for sales acceleration, and email engagement for customer retention. :contentReference[oaicite:2]{index=2}
Create Reliable Data Collection
Content measurement commonly draws information from several systems, including web analytics, marketing automation, CRM platforms, social analytics, and intent data providers. Each system contributes part of the customer journey, but disconnected systems can produce inconsistent information.
Consistent tracking requires standardized naming conventions. Campaigns, content pieces, and promotions should follow the same conventions so that the resulting data can be segmented and analyzed consistently. The resource specifically emphasizes disciplined UTM tagging and gives an example of standardized campaign parameters. :contentReference[oaicite:3]{index=3}
Data hygiene should be treated as an ongoing responsibility. The resource identifies six practices:
- Audit UTM parameters regularly.
- Use standardized content categories.
- Review data sources for accuracy and completeness.
- Document metric definitions and calculation methods.
- Clean duplicate or corrupted records.
- Validate information across platforms and resolve discrepancies.
Quantitative data also benefits from qualitative context. On-page surveys can help explain engagement changes, while heat maps, session recordings, and other behavioral inputs can provide context around navigation and conversion barriers. :contentReference[oaicite:4]{index=4}
Design a Scalable Measurement Architecture
A measurement plan should connect business objectives to the specific tracking implementations required to evaluate them. This creates a structured path from strategic goals to data collection rather than adding metrics simply because a platform makes them available.
Governance is part of the architecture. The resource recommends clearly assigning responsibility for data accuracy, interpretation, and action. It also recommends regular data reviews and tool audits so that integration problems and changes in measurement requirements are addressed before they undermine the system. :contentReference[oaicite:5]{index=5}
2. Use Attribution to Understand Content's Influence
Once the data foundation is reliable, the next challenge is understanding how individual content touchpoints contribute to the buyer journey.
Last-click attribution gives full credit to the final interaction before conversion. This can hide the contribution of content that influenced a prospect much earlier. A prospect might first discover a company through a blog post, attend a webinar, download resources, and eventually request a demonstration. A model that credits only the final touchpoint provides an incomplete picture of that journey. :contentReference[oaicite:6]{index=6}
Choose Attribution Based on Business Reality
Attribution models determine how credit is distributed across customer touchpoints. The appropriate approach depends on factors such as conversion volume, sales cycle length, customer journey complexity, and the analytical capabilities available to the organization.
The resource cautions against choosing the most sophisticated model simply because it is available. A growing SaaS business with limited monthly conversion volume may benefit more from an appropriately configured time-decay approach than from a data-driven model that lacks enough training data to produce stable results. :contentReference[oaicite:7]{index=7}
Build an Attribution Framework
Attribution should include meaningful touchpoints rather than every interaction a visitor has with a website or campaign. The resource identifies examples such as significant blog engagement, resource downloads, webinar attendance, content-related email engagement, social engagement, and substantial video completion.
Low-intent interactions should not automatically receive attribution simply because they are easy to track. The relevant question is whether an interaction demonstrates meaningful influence and correlates with conversion patterns in the organization's data.
Technology selection should also reflect the organization's needs. Google Analytics 4, HubSpot, and dedicated attribution platforms can provide different levels of sophistication and customization. The resource recommends evaluating tools based on the incremental insight they provide relative to their implementation and management cost. :contentReference[oaicite:8]{index=8}
Turn Attribution Into Revenue Decisions
Attribution becomes useful when it changes decisions. Content should not be evaluated solely by traffic volume. A resource that attracts fewer visitors but consistently appears in valuable customer journeys may deserve more investment than content generating large amounts of low-value traffic.
Attributed performance can also inform budget allocation. If certain content formats repeatedly appear in credited pipeline while consuming relatively little budget, that pattern may support increased investment. Conversely, content consuming significant resources but generating little attributed value may warrant optimization or reallocation.
3. Build Useful Tools, Dashboards, and Automation
Analytics technology should make reliable information easier to use rather than adding complexity for its own sake.
Choose Technology for Incremental Insight
Native analytics and reporting tools can provide strong integration and ease of use, while specialized platforms can offer more advanced tracking, segmentation, or attribution capabilities. The resource emphasizes balancing capability against implementation complexity.
Organizations can also over-invest in technology while under-investing in the processes and skills needed to use it effectively. A new platform should therefore be evaluated according to the additional questions it can answer and the value of those insights relative to its cost and complexity. :contentReference[oaicite:9]{index=9}
Design Dashboards Around Decisions
A dashboard should help a specific stakeholder understand what is happening and what deserves attention. Self-service dashboards can reduce dependence on manual analyst reports and allow content teams to access useful information more quickly.
The goal is not to display every available metric. A useful dashboard provides the information required to understand performance, identify important changes, and support decisions.
Automate Repetitive Reporting
Automation can reduce the manual effort required to collect and distribute recurring reports. The resource recommends auditing integration gaps, prototyping stakeholder-specific dashboards, and automating repetitive reporting tasks.
The objective is not automation for its own sake. Automated reporting should reliably deliver useful insights so that teams can spend more time interpreting results and acting on them. :contentReference[oaicite:10]{index=10}
4. Turn Analytics Into Continuous Optimization
Measurement has limited value if it stops at reporting. The next step is to use observed patterns to identify opportunities, formulate hypotheses, run experiments, and incorporate the resulting learning into future decisions.
Move From Observation to Hypothesis
Descriptive analytics can reveal that something is happening without explaining what should change. A page may receive substantial traffic but generate weak conversion. An email sequence may experience engagement drop-offs at predictable points. A particular group of content may repeatedly appear in valuable customer journeys.
These patterns should become questions about possible causes and interventions. The resource recommends asking why a pattern exists and translating the resulting observation into a specific, testable hypothesis. :contentReference[oaicite:11]{index=11}
Prioritize High-Leverage Opportunities
Not every potential improvement deserves equal attention. The resource describes ICE/PIE-style prioritization around Impact, Confidence, and Effort.
High-impact, high-confidence, low-effort opportunities should generally rise to the top of the testing queue. This helps teams avoid spending disproportionate resources on large projects when smaller changes may provide faster learning or meaningful improvements.
The resource provides examples such as testing an ROI calculator on a pricing page, changing email layouts, creating comparison-guide content, and implementing a chatbot on landing pages. These examples demonstrate how potential impact, confidence, and implementation effort can be used to establish a priority order. :contentReference[oaicite:12]{index=12}
Define Success Before Testing
Success metrics should be established before an experiment begins. A north-star metric provides the primary measure for evaluating the test, while supporting metrics add context around user behavior and funnel health.
Defining these measures in advance reduces the risk of changing the evaluation criteria after results appear or selecting only favorable outcomes. :contentReference[oaicite:13]{index=13}
Document and Scale What You Learn
Experiments become more valuable when their learning is retained. The resource recommends maintaining a centralized experiment repository that records hypotheses, methodology, results, and subsequent applications.
Ownership should also be explicit. Hypothesis creation, technical setup, analysis, and rollout decisions can have different owners. Clear responsibility helps experiments progress from idea through implementation and scaling rather than becoming projects without a clear champion. :contentReference[oaicite:14]{index=14}
Optimization should operate as a continuous cycle. Winning variations should feed back into content planning and budget allocation. Null results and unsuccessful experiments should also be documented because they prevent teams from repeating ineffective approaches and can improve future hypotheses.
5. Prove Content's Value to the C-Suite
The final stage is translating content analytics into the language of executive decision-making.
Executives typically care less about isolated marketing activity and more about revenue growth, cost efficiency, market position, sales predictability, and other strategic priorities. The resource argues that analytics becomes more influential when content teams connect their measurements directly to these concerns. :contentReference[oaicite:15]{index=15}
Map Metrics to Executive Priorities
Different executives may evaluate content through different business questions. CEOs may focus on market position and competitive differentiation. CFOs may focus on cost efficiency and resource allocation. Revenue leaders may focus on pipeline predictability and sales acceleration.
The resource recommends establishing a primary measurement for each executive priority. Examples include:
- Revenue growth: Content-influenced pipeline.
- Cost efficiency: Customer acquisition cost by channel.
- Sales acceleration: Average deal size for content-sourced opportunities.
- Competitive position: Organic search visibility against relevant competitors.
This translation changes the conversation from reporting marketing activity to explaining business impact. :contentReference[oaicite:16]{index=16}
Tell a Clear Executive Story
Executive communication requires discipline. The resource recommends leading with the business result, connecting that result to the underlying content activity, and explaining what the organization should do next.
Visual storytelling should reinforce the central insight rather than overwhelm the audience with metrics. The resource recommends waterfall charts for pipeline attribution, trendlines for competitive analysis, and simple bar charts for performance comparisons. It also recommends limiting each slide to one primary insight supported by relevant data. :contentReference[oaicite:17]{index=17}
Make Executive Reports Stand Alone
Executive summaries should communicate their core value without requiring a separate presentation. The resource recommends concise reports using business language instead of marketing jargon, with clear connections between content performance, strategic priorities, results, and recommendations. :contentReference[oaicite:18]{index=18}
The purpose is to make analytics useful for decisions such as resource allocation, investment planning, and strategic direction.
6. Follow the Analytics Mastery Roadmap
The resource presents the analytics journey as a dependency chain. Reliable measurement requires clean data. Optimization requires reliable measurement. Executive influence requires results that can be connected back to that measurement and optimization process.
This means organizations should resist skipping foundational work in pursuit of sophisticated analytics. Advanced models built on unreliable data can produce unstable insights and lead to poor decisions.
The roadmap connects each major stage with a practical organizational asset:
- Foundation: A KPI framework connected to business outcomes and standardized tracking definitions.
- Attribution: Multi-touch revenue attribution and reports showing content's influence on pipeline.
- Tools: An automated analytics stack with stakeholder-specific dashboards and recurring reports.
- Optimization: A systematic experimentation process with documented learning.
- Executive communication: Board-ready presentations and executive summaries linked to strategic goals.
The resource's roadmap therefore describes analytics not as a single reporting project but as an operating system for making better content investment decisions. :contentReference[oaicite:19]{index=19}
7. Build a Measurement Culture That Continues to Improve
A mature analytics program requires more than dashboards and technology. It requires processes that keep measurement trustworthy and make learning part of normal operations.
Regular data-quality reviews help identify tracking and integration problems. Measurement plans should also be revisited as business priorities change. Experiment repositories preserve institutional knowledge, while shared metrics and post-mortems help teams learn from both successful and unsuccessful tests.
Optimization can operate on several time horizons. Regular experiments address immediate opportunities, while accumulated learning can influence quarterly editorial planning, campaign priorities, and budget allocation. This creates a feedback loop between analytics, experimentation, and strategic planning. :contentReference[oaicite:20]{index=20}
8. Future-Proof the Analytics Strategy
Content measurement must evolve because customer behavior, technology, and business priorities change. The resource recommends periodically reassessing whether attribution windows reflect actual customer journeys, whether KPIs still predict business outcomes, whether relevant touchpoints are being captured, whether the technology stack justifies its complexity, and whether reporting reflects what executives actually care about.
The resource also discusses server-side measurement and machine learning as developments that can support future measurement capabilities. Server-side approaches can improve data accuracy while respecting privacy preferences when properly implemented, while machine learning can be used to identify patterns such as potentially valuable topics, publication timing, or content-format preferences. :contentReference[oaicite:21]{index=21}
The underlying principle remains consistent: new technology should strengthen measurement and decision-making rather than introduce complexity without corresponding insight.
Putting the Framework Into Practice
The complete approach can be summarized as a progression:
- Define the business outcomes. Start with what the organization needs to achieve rather than the metrics that are easiest to collect.
- Establish meaningful KPIs. Connect objectives to measurable indicators and supporting metrics.
- Clean and standardize the data. Use consistent tracking conventions, definitions, and governance.
- Understand the customer journey. Identify meaningful content touchpoints and select an attribution approach appropriate to the available data.
- Build useful reporting. Give stakeholders access to dashboards and automated reports that support decisions.
- Identify high-leverage opportunities. Use observed patterns to formulate specific hypotheses.
- Prioritize and test. Evaluate potential experiments based on impact, confidence, and effort, then define success metrics before testing.
- Document learning. Preserve experiment results and connect successful findings back to planning and resource allocation.
- Communicate business value. Translate content performance into the language of revenue, efficiency, sales acceleration, and strategic priorities.
- Review and evolve. Periodically reassess data quality, attribution, KPIs, technology, and executive reporting.
Following this progression helps prevent a common failure mode: trying to solve advanced measurement problems before the underlying data and definitions are trustworthy.
Why the Complete Resource Matters
This landing page provides the central concepts and practical framework, but the complete resource goes deeper into the individual stages of the analytics journey. It includes detailed guidance on KPI selection, data collection, tracking architecture, attribution, analytics tools, dashboards, automation, hypothesis development, experimentation, governance, executive storytelling, reporting, and future-proofing.
It also provides practical examples, structured frameworks, tables, implementation considerations, and an action-oriented roadmap that can be used to turn the concepts into an ongoing analytics practice.
Download the complete resource to work through the full framework and build a more reliable connection between content activity, customer journeys, business outcomes, and investment decisions.